I started our first podcast on investing this week. You can check it out below.
https://anchor.fm/letstalkaboutitfinance/episodes/Investing-Basics-e1jsrmlIf we’re talking about stock trading I thought it might be helpful to take a look at a basic stock quote. Here’s a snip from google finance for AT&T.
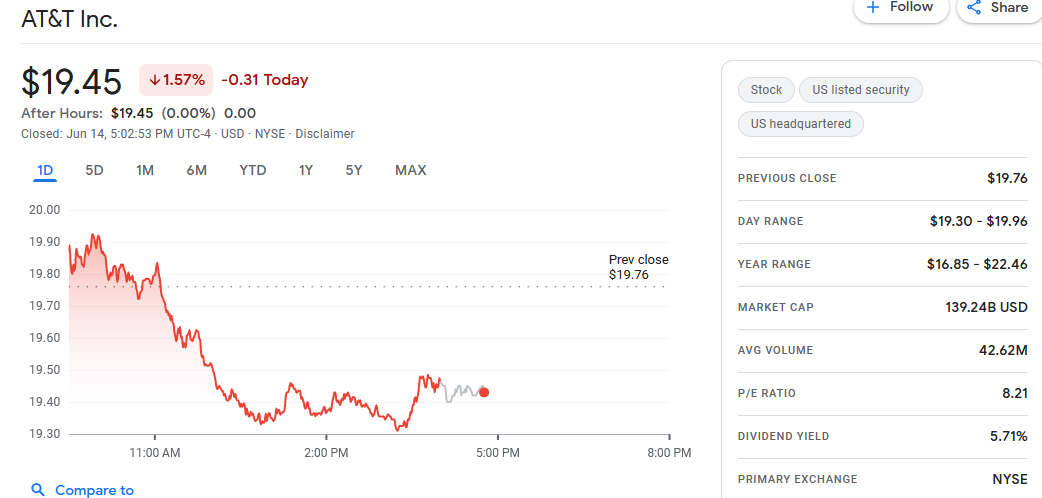
This gives us a few basic pieces of information. I will say that it’s not the full picture, feeds from exchanges cost money, but for long term investors having that level of detail isn’t as necessary.
I took this snip after hours. That means that markets were closed when I looked at the quote. So this gives us the day’s trading price, and the closing price.
Along the top of the chart you can see different periods of time. There are many different charts that can be used to price a stock, which is part of technical analysis. A line graph like this shows the journey the price has taken. You can look back at longer time frames to see how the price has moved over those times.
Previous close tells you what the price was at the end of the previous day. That one day chart will start with the open, if the price moves significantly between the open and previous close you can quickly see that by referencing this number.
Day range gives you an idea of the width prices have taken, but don’t give you any idea of volume or volatility throughout the day. It merely gives you the top price and bottom price a stock transacted at.
The year range is the same as the day range but for the previous 365 days. So the lowest a stock has traded and the highest a stock has traded in the last year.
Market cap, or market capitalization refers to the total value of a company. It’s calculated by multiplying the total number of shares by the current price.
Average volume can be helpful if you’re not sure how concerned about liquidity (or the availability and frequency a stock trades) you need to be about trading a stock. The higher the volume the more shares trade on average. If millions of shares trade per day and you’re looking to buy or sell hundreds of shares, then you’re going to be a tiny percentage. If a stock has an average volume of 150k and you’re looking to buy 20k shares, you need to be very careful not to move the market when you buy. On a more detailed chart you’d be able to see volume throughout the day.
P/E ratio (price to earnings ratio) is used in valuation. It’s the cost of the profitability of a company. Different companies and different industries will trade normally at different P/E ratios. The P/E refers to how much you’re paying for the profits of a company. The lower the P/E the more affordable those profits are. In this case a P/E of 8.21 tells us that each share costs 8.21 times the earnings per share of the company.
Dividend yield tells you how much as a percentage the current annual dividend payout is relative to the current price. So in this case if AT&T continues to pay dividends as it has, the current annual dividend distribution is the same as 5.71% of the current price.
Primary exchange lets us know which exchange the company is listed on, it doesn’t mean when you trade the stock you will trade on that exchange, and in fact there are many exchanges it could be traded on. This at least lets you know what it’s trading hours will be and where the trading is based from.
There’s a lot more depth of data you can dig into when it comes to trading but for a long term investor a lot of the day to day minutia isn’t as important because you’re not trying to time the market.
Like many things when it comes to finance they’re presented as more complicated and dense then they actually are. By breaking down some of these terms you can see that they’re just meant to give you a quick idea of what’s going on with a stock.